
7 Ways to Report on Your Data in Dynamics 365 Business Central (And How to Pick the Right One)
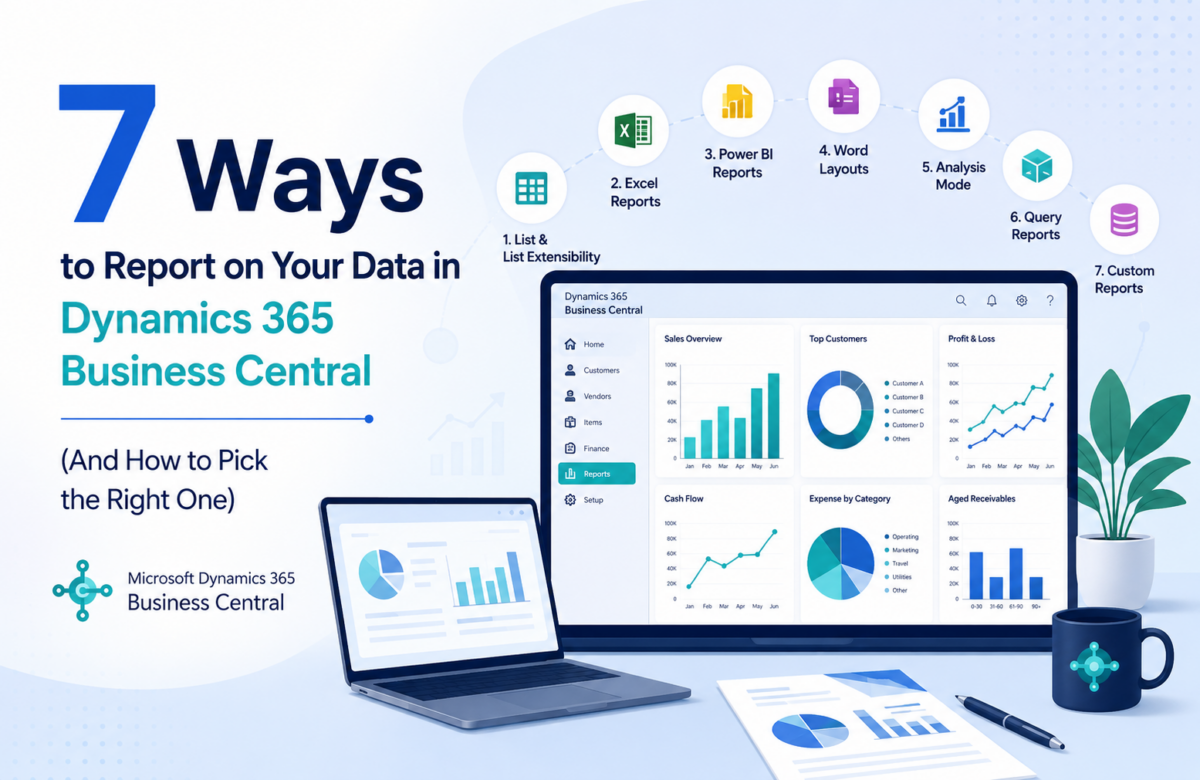
If you’ve ever asked your finance team for a number and waited three days for an answer, you already know the problem this article is about. Most Business Central users only ever touch one or two reporting features usually because nobody showed them the rest exist. That’s a shame, because Business Central actually ships with a surprisingly rich set of reporting tools, each built for a different question and a different audience.
This guide walks through all seven of them in plain language, so you can stop reaching for the same report every time and start picking the one that actually fits the question in front of you.
Start With Who’s Asking, Not What Tool You Know
Before picking a reporting option, it helps to think about who is going to read the output. A useful way to frame this is a simple pyramid:
- Leadership wants high-level KPIs, trends, and a handful of numbers that tell a story at a glance.
- Management needs comparative, dimensional views this region versus that one, this month versus last.
- Staff need detailed, transaction-level lists to get through the day’s work.
Data gets more detailed as you move down that pyramid and more summarized as you move up it. Keeping this in mind before you open a report saves a lot of back-and-forth later, because a beautifully detailed transaction list is wasted on a CFO who just wants to know if gross margin is trending up or down.
The Seven Reporting Options in Business Central
1. Standard Analytical Reports
These are the classic, built-in reports that have shipped with Business Central for years Vendor Purchases by Item, Customer Order Summary, Aged Accounts Receivable, and dozens more. You set your filters, hit preview or print, and the report runs. What’s changed recently is the option to output these into fully customizable Excel layouts, so you keep the same underlying data and logic but get your own tables, pivot tables, charts, and formatting instead of a fixed template. You’ll typically find them under Role Explorer > Reports & Analysis, grouped by area Finance, Sales, Purchasing, Inventory, and so on.
Best for: quick, familiar, print-ready reports staff and controllers already know how to run.
2. Analysis Views
Analysis Views are easy to confuse with Data Analysis mode, but they’re a different feature entirely. An Analysis View is a saved definition that tells Business Central to take the General Ledger and let you pivot it across chosen dimensions Department, Location, Project, whatever your business tracks. Once it’s configured, you can revisit it any time to slice posted GL activity in ways a standard report simply can’t. You can find them through Tell Me/System Search, or from inside a Financial Report’s row or column definition. One thing worth knowing: views need to be refreshed to reflect new postings, either manually or by turning on the auto-update option on the view card.
Best for: finance teams who need repeatable, dimension-based cuts of GL data think departmental P&L or project profitability without building a custom report each time.
3. Filtered Views on Lists and the Chart of Accounts
Sometimes you don’t need a formal report at all you just need to look at a filtered list and remember that filter for next time. Saving filters on lists and the Chart of Accounts gives staff a fast way to answer everyday questions (“show me overdue invoices for this customer group”) without exporting anything.
Best for: recurring, simple questions that don’t need formatting or distribution just a quick on-screen answer.
4. Data Analysis Mode
This is the in-page pivot feature available on most lists in Business Central. Turn it on, and you can group, summarize, and rearrange data right where it lives, with no export to Excel required. It sits close to Analysis Views conceptually, but it works on general list data rather than being limited to the General Ledger.
Best for: ad hoc, exploratory questions the kind where you’re not sure exactly what you’re looking for until you start slicing the data.
5. Financial Reports
This is where your Income Statement, Balance Sheet, and Cash Flow statement live. Financial Reports in Business Central are built around row and column definitions, often tied back to Analysis Views for dimensional detail, giving you formal, structured statements suitable for management packs, board decks, or lenders.
Best for: formal, recurring financial statements that need consistency period over period.
6. Pre-Built Power BI Reports
Microsoft ships ready-made Power BI dashboards alongside Business Central, covering common areas like sales, finance, and inventory without requiring you to build a data model from scratch. They’re a solid starting point for visual, trend-based reporting before you invest in fully custom dashboards.
Best for: leadership-level dashboards and trend visualization with minimal setup.
7. Copilot
The newest addition to the list, Copilot lets you ask Business Central plain-language questions where to find something, what a number means, or how to pivot a dataset without knowing the exact menu path or report name in advance. It’s less a replacement for the other six tools and more a faster way to get to them.
Best for: users who know what question they’re asking but not which tool answers it.
So Which One Should You Use?
There isn’t a single “best” reporting tool in Business Central there’s a best-fit tool for the question you’re asking right now. A controller closing the books daily lives in Standard Analytical Reports and Filtered Views. A finance manager building a departmental P&L reaches for Analysis Views or Data Analysis mode. A CFO presenting to the board wants a Financial Report or a Power BI dashboard. And increasingly, everyday users are just asking Copilot to point them in the right direction.
The real skill isn’t memorizing all seven it’s recognizing, in the moment, which one matches the audience and the question. That’s a muscle that develops with time, but it develops a lot faster with the right guidance.
Getting the Reporting Setup Right, the First Time
Here’s where a lot of businesses lose time: they either overbuild chasing a custom Power BI dashboard for a question a saved filter could answer in ten seconds or they underuse what’s already sitting inside their system because nobody configured it properly during rollout. Reporting is one of the areas where good configuration during a Business Central implementation pays off for years afterward. Dimensions set up thoughtfully at go-live, Analysis Views built around how your leadership actually thinks about the business, Financial Report templates that match your existing management pack none of that happens by accident.
This is also usually where it makes sense to bring in outside expertise. A seasoned Dynamics 365 business central consultant has already seen dozens of businesses hit the same reporting wall, and can help you map your actual questions not generic best practices to the right combination of these seven tools. At Vaden Consultancy, this kind of reporting and dimension strategy is a standard part of our broader dynamics 365 business central services, alongside implementation, support, and ongoing optimization.
If your reporting needs are more involved custom Power BI models, extension development, or deeper Power Platform automation layered on top of Business Central — it’s often more efficient to bring in dedicated technical resources rather than pulling your internal team away from day-to-day operations. Many of our clients choose to hire dynamics 365 business central developers on a flexible, dedicated basis specifically for this kind of project work, scaling the team up during a build phase and back down once it’s stable.
The Takeaway
Business Central isn’t short on reporting options most teams are just short on knowing they exist. Once you can match the right one of these seven tools to the right audience and question, reporting stops being a bottleneck and starts being something your team reaches for confidently, on their own, most of the time.
If you’re not sure your current setup is using these tools well or if you’re planning an implementation and want reporting built in from day one instead of bolted on later that’s a conversation worth having early.
Follow VADEN Consultancy on LinkedIn for more insights on Microsoft Dynamics 365, Business Central, Power Platform, Power BI, AI, Azure Cloud, CRM, ERP, automation, cybersecurity, and business technology.